A-scan vs B-scan vs C-scan: what it means and why it matters
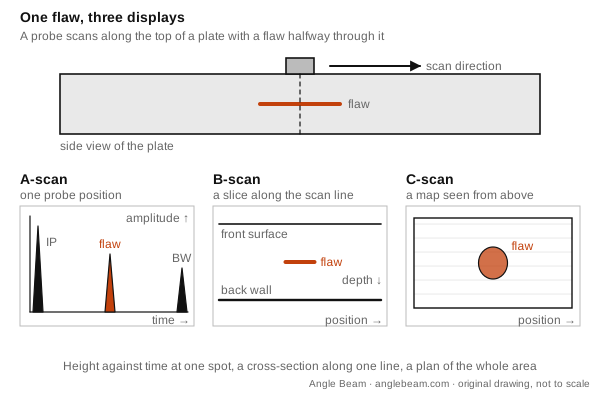
A-scan, B-scan and C-scan are three ways to display the same ultrasonic data. An A-scan plots echo amplitude against time at one probe position. A B-scan is a cross-section built from echo travel times along a scan line. A C-scan is a plan view of the part, mapped from above.
Use this diagram
A-scan: echo height against time
The A-scan is the familiar trace on a flaw detector screen. The vertical axis is how much sound came back to the probe, and the horizontal axis is elapsed time, which stands for distance traveled in the material. With the probe over the flaw in the figure you see three signals: the initial pulse near time zero, the flaw echo, and the back wall echo. The flaw echo sits about halfway between the pulse and the back wall, so the flaw is about halfway through the plate.
Two readings come from an A-scan. Depth comes from where the echo sits along the sweep. Relative size comes from comparing the echo's height with the echo from a known reflector, which is the idea behind a DAC curve. Most instruments can show the trace as the raw RF signal, fully rectified, or as only its positive or negative half. The tall initial pulse at the left also hides shallow echoes in the dead zone.
On an angle beam scan the sweep measures sound path along the angled beam, not straight-down depth. The reflector's depth and its distance from the probe are worked out with the same geometry as skip distance.
B-scan: a slice along the scan line
A B-scan is a cross-section of the part. The horizontal axis is the probe's position along the scan line, and the vertical axis is travel time, which stands for depth. It is usually built by setting a gate on the A-scan: each time a signal is strong enough to trigger the gate, the system plots a point at that position and time. Move the probe along the plate and the points join into lines. In the figure the back wall draws a long line near the bottom, and the flaw draws a shorter line at mid-depth whose length roughly matches the flaw's length along the scan.
From a B-scan you read depth and approximate length in the scan direction. You do not get the flaw's width across the scan line. One limit to remember: a large reflector near the surface can mask smaller reflectors beneath it.
Try one question
Question 1 of the free 10-question check on UT L2. No signup. Then ask Echo, the AI study assistant, why the answer is right and the others are wrong.
Discontinuity Detection
A planar reflector gives its highest echo amplitude when the beam strikes it
Press A-D or 1-4 to choose an answer while this question is on screen.
Choose an answer to begin
C-scan: a map from above
A C-scan is a plan view. The image lies in the same plane as the probe's scan pattern, so it looks down on the part the way the top view of a drawing does. A gate on the A-scan records either the echo amplitude or the time-of-flight at regular steps as the probe covers the area, and each step becomes one spot in a shade of gray or a color. The flaw in the figure shows up as a patch whose outline gives its length and width.
C-scans come from automated data collection, such as a computer-controlled immersion scanning system, because the probe has to cover the area at regular, recorded positions. An amplitude C-scan shows where a reflector is and how big it looks from above, but not how deep it is. Record time-of-flight instead if depth is what you need. Modern computerized systems can show all three displays at the same time.
Side by side
| A-scan | B-scan | C-scan | |
|---|---|---|---|
| What it plots | Amplitude against time | Travel time against probe position | Amplitude or travel time at each position |
| View of the part | One spot | Cross-section (side view) | Plan (top view) |
| What you read | Depth and relative size | Depth and length along the scan | Length and width, and depth if timed |
| How it is made | Straight from the received signal | A gate on the A-scan along a line | A gate on the A-scan over an area, automated |
Mix-ups to avoid
- Which axis is time. On an A-scan time runs along the bottom. On a B-scan it runs down the side, and probe position runs along the bottom.
- Profile versus plan. The B-scan is the side view, a slice through the part. The C-scan is the top view. If you need a flaw's length and width together, you need the C-scan.
- Depth on a C-scan. An amplitude C-scan carries no depth. Only a time-of-flight gate puts depth into the picture.
- Size on an A-scan. Echo height gives relative size only when you compare it with a known reflector. A tall echo on its own does not prove a large flaw.
How the exam uses it
Naming a display from a sketch, saying what each axis means and knowing what you can measure from it are the core skills. Before 5 February 2027 this sits under the Review of Ultrasonic Techniques and General Evaluation headings. The later outline lists UT Data Collection, Interpretation, and Reporting, which includes interpreting indications.
Topic names here follow the UT General outline for exams before 5 February 2027; the UT outline change guide shows how the later list lines up.
Ask Echo: Am I ready?
Ask Echo before you buy AI your AI study assistant
See what's on the UT L2 exam, test yourself with 5 quick questions, or find the plan that fits you.
The UT L2 course
Available now · instant accessLearn every General exam topic, work the calculations step by step, then prove it on timed exams.
Instant access. Terms and refunds · Secure checkout by Stripe · Billed by Nori Software
What's inside
- 7modules of lessonsEvery task on the outline
- 5full-length timed exams50 questions in 120 minutes each
- 387practice questionsEach one explained
- 5worked calculationsStep by step
- 1week-by-week study planSet to your exam date
Turn a practice answer into a study step. In untimed practice, ask Echo AI about any question you answer, follow up, then see your weakest topics and what to drill next.
- UT, MT and PT bundle$299$108 less than buying the 3 courses separatelyIncludes the UT L2, MT L2 and PT L2 courses
Terms and refunds · Secure checkout by Stripe · Billed by Nori Software
- Question of the dayFree
Every answer comes with a full explanation.
Practice it
Practice the UT General topics in the UT Level 2 quiz, then read the evaluation topics in the UT General exam guide. What hides shallow echoes at the start of an A-scan is the dead zone, and how angle beam sound path turns into a position on the plate is skip distance. All terms are in the NDT terms glossary.
Know the term? Check the rest of the UT General topics
Take the free 10-question check. It covers the UT General exam, needs no signup and explains every answer, so you see which topic to study next. The course then adds timed practice exams and a study plan built from your exam date.
Sources
Show the list
Background reading: the NDT Resource Center's page on ultrasonic data presentation and ASNT's published topic headings. Both checked 18 Nov 2026.
- NDT Resource Center, ultrasonic data presentation, A-scan, B-scan and C-scan. Checked 18 Nov 2026.
- ASNT NDT Level II examinations, published topic headings. Checked 18 Nov 2026.
Not affiliated with or endorsed by ASNT.
Angle Beam editorial team
Facts come from the sources listed above. If something has changed, tell us and we will correct it.
Your next step
Ready to see where you stand on UT L2?
Free, untimed and scored by domain. No signup.
Free 10-question checkNDT UT Level II General course. Lessons, timed practice exams and a plan around your exam date.
Get NDT UT Level II General course · $149Want a timed run? Take the free 25-question practice test (about 60 minutes). No email needed.
Prefer paper? Free printables
- Print the study checklist (free PDF). Topics to cover, on one printable page. No email.
- Print a class quiz (free PDF). 6 practice questions with an answer key on page 2.
- Print the flashcards as cut-out cards (free PDF). The free flashcard sample, ready to cut and carry.
From the blog
- Near field, beam spread and dead zone: how they differ in UT
- Snell's law in UT: worked examples and critical angles
- Skip distance formula in ultrasonic testing: worked examples